![Neeve-Logo-Lockup-SM_rectangle_reverse .png]](https://support.neeve.ai/hs-fs/hubfs/Neeve-Logo-Lockup-SM_rectangle_reverse%20.png?height=40&name=Neeve-Logo-Lockup-SM_rectangle_reverse%20.png)
Step 1: Preliminary Troubleshooting
Before capturing logs, perform a quick re-authentication check:
- Log out of the Neeve portal completely.
- Log back in to see if the blank screen issue resolves itself.
- Note: Please do not clear your browser cache or cookies yet, as doing so will erase the diagnostic logs needed for investigation.
1. Pre-Collection Setup Checklist
Before initiating an issue reproduction and downloading the HAR file, support engineers must ensure Developer Tools are configured correctly:
- Open Developer Tools: Press F12 or Ctrl + Shift + I (Windows/Linux) in the browser.
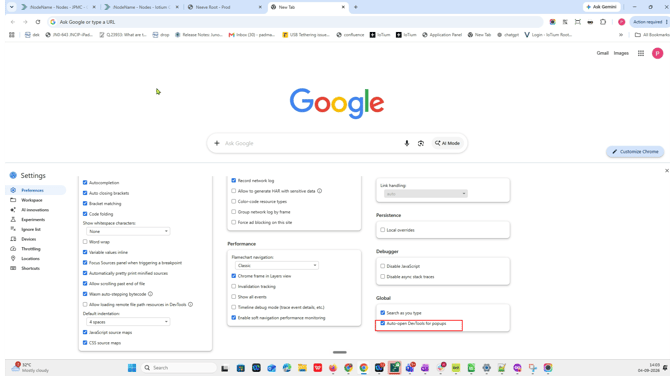
- Enable DevTools Settings: Click the Gear icon (Settings) in DevTools and ensure Auto-open DevTools for popups is enabled (under Global / Preferences).
Step 2: Configure Developer Tools in Chrome
To capture all necessary logs, you need to configure Google Chrome’s Developer Tools:
- Open Chrome and press F12 (or Ctrl + Shift + I on Windows/Linux, Cmd + Option + I on Mac) to open Developer Tools.
- Click the Gear Icon (Settings) in the top-right corner of the Developer Tools panel.
- Under Preferences > Global, check the box for Auto-open DevTools for popups.
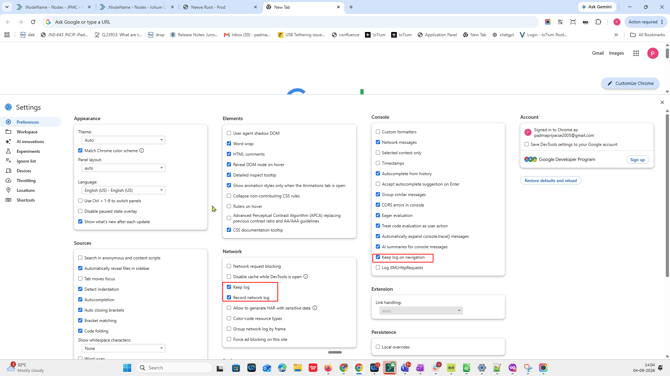
4. Go to the Network tab in Developer Tools and check the box for Preserve log.
5. Go to the Console tab in Developer Tools and check the box for Preserve log (or Keep log).
Step 3: Reproduce the Issue & Export Logs
Keep the Developer Tools panel open while completing the following steps:
- Reproduce the Issue: Perform the actions in the portal that lead to the blank or white screen.
- Export the HAR File:
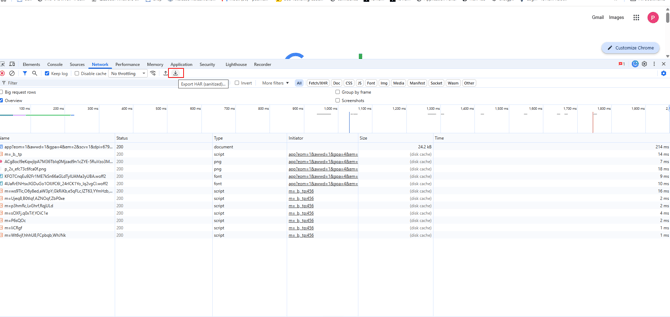
- In Developer Tools, go to the Network tab.
- Click the Export HAR icon (a downward-pointing arrow) to download the
.harfile to your computer.
- Export Console Logs:
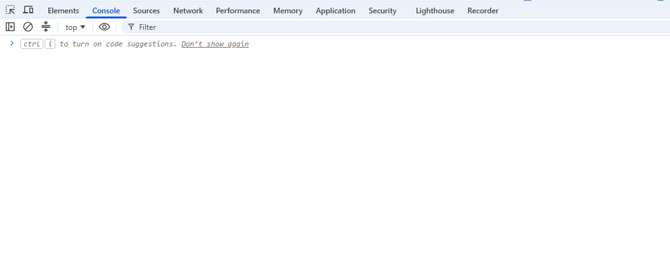
- Go to the Console tab.
- Right-click anywhere inside the console text area and select Save as... to export the
.logor.txtfile.
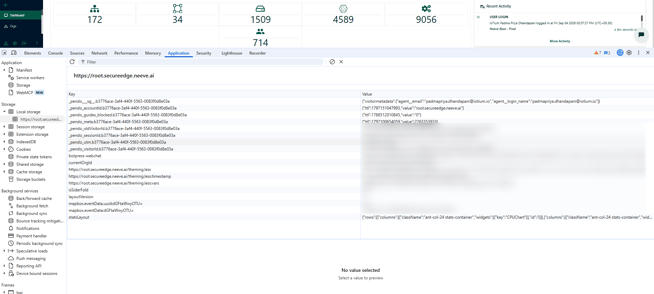
4. Capture Storage Data:
- Go to the Application tab.
- In the left sidebar, expand Local Storage and Session Storage.
- Take clear screenshots of the listed entries or copy the key-value pairs during your active session.
Step 4: Submit to Support
Once collected, attach the following files to your support request or email:
- The downloaded HAR file (
.har) - The exported Console log (
.logor.txt) - Screenshots or details of the Local and Session Storage
- Your exact Browser Name and Version Number (e.g., Google Chrome Version 122.0.6261.94)